2. Egypt Economic Outlook
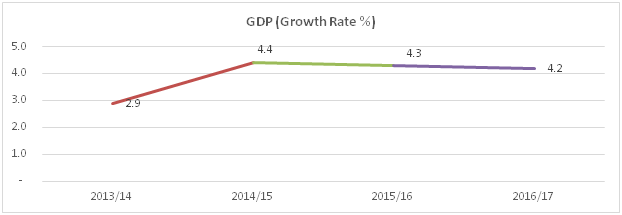
2.1 Macroeconomic Indicators Annual nominal GDP reached USD 234.7 billion in 2016/17 with a 4.2% growth (real GDP growth rate at market prices) from the previous year. In 2015/16, nominal GDP amounted to USD 332.8 billion with a growth rate of 4.3%.
These growth rates are mainly attributed to household consumption (82%), followed by the gross capital formation (i.e. investments and inventories), representing around 16.8%, while government consumption did not exceed the 11.8% in 2016/17. On the other hand, the foreign exchange shortages and overvaluation of the Egyptian Pound (EGP) cut down Egypt’s exports affecting competitiveness and growth (with a negative contribution of 10.7% to the GDP) during the same year.
Some sectors are underperforming, with tourism being among the most affected, resulted in a negative effect on growth. External factors also affect Egypt’s growth including liquidity issues, the Euro Zone instability and the decline in workers’ remittances because of the lower oil prices in Gulf countries.
In November 2016, CBE floated the EGP, and adopted tightening monetary policies to curb inflation. As a result, the budget deficit declined in FY 2016/17 reaching 9.8% of GDP relative to 11.3% in FY2015/16 and 11.5% in FY2013/14. Monthly inflation rates jumped dramatically after the currency floating and partially lifting energy subsidies, reaching their peak in July, 2017 (33%). Annual inflation, however, amounted to around 30% and 14% in 2016 and 2017 respectively.
Table 1: Egypt’s Key Macroeconomic Indicators
Source: ECES, Egypt's Economic Profile & Statistics, 2018.
« Back to DBI Egypt
These growth rates are mainly attributed to household consumption (82%), followed by the gross capital formation (i.e. investments and inventories), representing around 16.8%, while government consumption did not exceed the 11.8% in 2016/17. On the other hand, the foreign exchange shortages and overvaluation of the Egyptian Pound (EGP) cut down Egypt’s exports affecting competitiveness and growth (with a negative contribution of 10.7% to the GDP) during the same year.
Figure 2: GDP Growth Rate
Source: ECES, Egypt's Economic Profile & Statistics, 2018.
Source: ECES, Egypt's Economic Profile & Statistics, 2018.
Some sectors are underperforming, with tourism being among the most affected, resulted in a negative effect on growth. External factors also affect Egypt’s growth including liquidity issues, the Euro Zone instability and the decline in workers’ remittances because of the lower oil prices in Gulf countries.
In November 2016, CBE floated the EGP, and adopted tightening monetary policies to curb inflation. As a result, the budget deficit declined in FY 2016/17 reaching 9.8% of GDP relative to 11.3% in FY2015/16 and 11.5% in FY2013/14. Monthly inflation rates jumped dramatically after the currency floating and partially lifting energy subsidies, reaching their peak in July, 2017 (33%). Annual inflation, however, amounted to around 30% and 14% in 2016 and 2017 respectively.
Table 1: Egypt’s Key Macroeconomic Indicators
| Item | 2013/14 | 2014/15 | 2015/16 | 2016/17 |
| Inflation Rate | ||||
| CPI (Headline Urban) (%) | 8.2 | 11.39 | 13.97 | 29.76 |
| PPI (%) | 4.3 | -2.25 | 5.68 | 34.9 |
| Exchange Rate (LE/$) | 7.14 | 7.61 | 8.88 | 18.029 |
« Back to DBI Egypt